Profitability ratios
Profitability ratios give an indication of the earning capacity of an entity. The ratios measure the effectiveness of a company in meeting the profit objectives both in the long run and short run. The ratios show how well a company employs its resources to generate returns (Collier, 2012). The table below summarizes the profitability ratios of the company for two years.
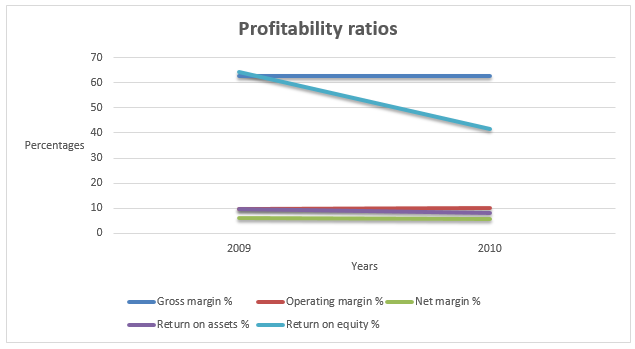
The gross profit margin increased by a small margin that is, from 62.55% in 2009 to 62.8% in 2010. Similarly, operating margin increased by a small margin that is, from 9.81% in 2009 to 9.88% in 2010. However, the net profit margin declined from 6.03% in 2009 to 5.58% in 2010. This implies that the ability of the management to manage costs to generate profit declined over time. The return on assets similarly declined from 9.7% in 2009 to 8.25% in 2010. This implies that the profitability per unit of total asset declined. This could be an indication that the management is not using the assets efficiently to generate income. Finally, the return on equity declined by a large margin that is, from 64.27% in 2009 to 41.4% in 2010. Generally, the profitability of the company declined over time. The graph below shows the trend of the ratios for the two years.
Debt ratios
A company’s leverage is explained by the amount of debt financing it holds. The ratios are vital since they show the extent of exposure of equity financing. A commonly used ratio is the debt to equity ratio (Collier, 2012).
The amount of times interest earned ratio increased from 9.84 times in 2009 to 11.85 times in 2010. A high value of times interest earned ratio is a good indication since it shows that the ability of the company to pay interest expense is increasing. Debt to equity ratio declined from 1.95 times in 2009 to 1.54 times in 2010. It is a good indication since it shows that the leverage level of the company declined. The graph below shows the debt ratios of the company.

Efficiency ratios
Efficiency ratios focus on the internal operations of the company. These ratios show the level of activity in a company. It focuses on efficiency in allocation of resources with an aim of maximizing output and income from the resources available (Collier, 2012).
Days in inventory increased from 97.41 in 2009 to 100.27 in 2010. This implies that the inventory takes before being replaced. The other turnover ratios also declined. Receivables turnover ratio declined from 14.15 in 2009 to 13.53 in 2010. The inventory turnover ratio also declined from 3.75 in 2009 to 3.64 in 2010. Finally, the asset turnover ratio declined from 1.61 in 2009 to 1.48 in 2010. Declining turnover ratio implies that the efficiency of the company declined in that period. The graph below shows the trend of the efficiency ratios.

From the analysis above, it is clear that the financial health of Avon Products Inc. declined over the two year period. The debt ratios of improved in the period. This can be attributed to decline in the amount of total debt in the capital structure.
Reference
Collier, P. (2012). Accounting for Managers. London: John Wiley & Sons Ltd.